Context
ISP engineering teams live across a fragmented toolchain. On any given shift an operator may bounce between Winbox or RouterOS for Mikrotik node management, a GenieACS console for TR-069 provisioning, a RADIUS console for authentication, a custom billing portal, a separate helpdesk like JIRA or Zendesk, Grafana or Zabbix for monitoring, and raw SSH.
Each handoff is friction. Engineers lose time, act on stale data, and lack a single view that correlates network health with billing, ticket load, or device state. The cost is measured in slower incident response, missed SLAs, and burned-out shifts.
Forge ISP exists to consolidate that toolchain into one coherent environment without dumbing down any of it - 13 surfaces, from real-time network health to TR-069 device provisioning to subscriber billing, wired together by a consistent visual language and a navigation model organised around how engineers actually work.
Process
Design principles
Reduce cognitive load, not capability. Simplification means giving every feature a logical home and surfacing only what is contextually relevant. It does not mean cutting power-user functionality.
Calm over loud. The first iteration used a high-glare amber against deep brown. Operators flagged eye fatigue across long shifts, so the palette was retuned around a warm cream surface, a single muted amber primary (#B45309), and ghost-fill active states instead of solid highlights. The dashboard had to hold up under an eight-hour NOC watch.
Flow-first navigation. The sidebar is grouped by operational intent rather than feature taxonomy - Operations (Network, Subscribers, Tickets), Management (Plans, Infrastructure, Mikrotik, ACS / TR-069, Billing, Analytics, NOC), and System (Settings, Security, Help).
Network Overview - the home base
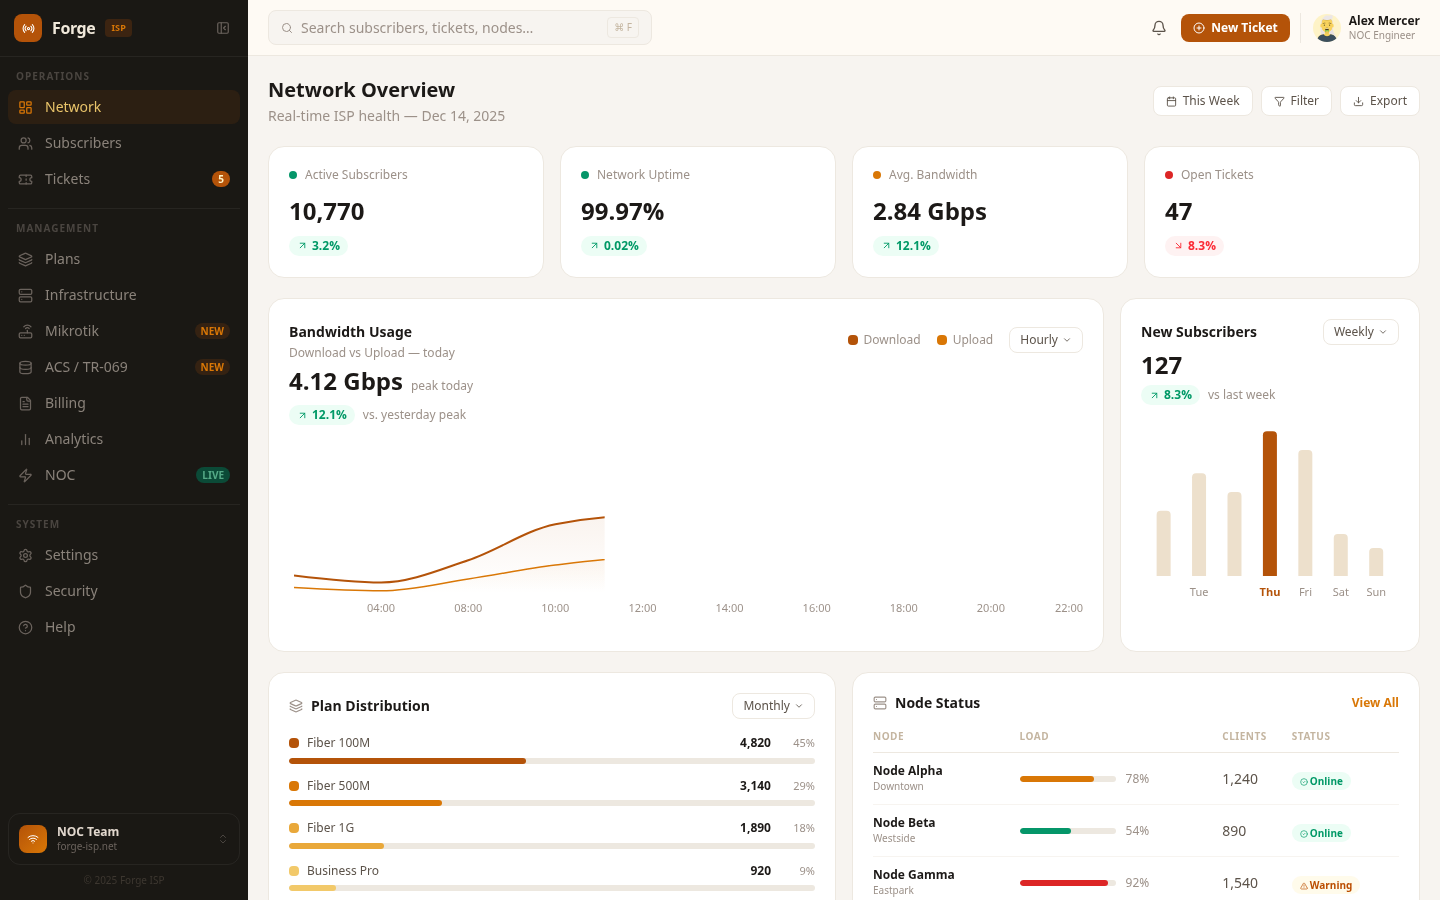
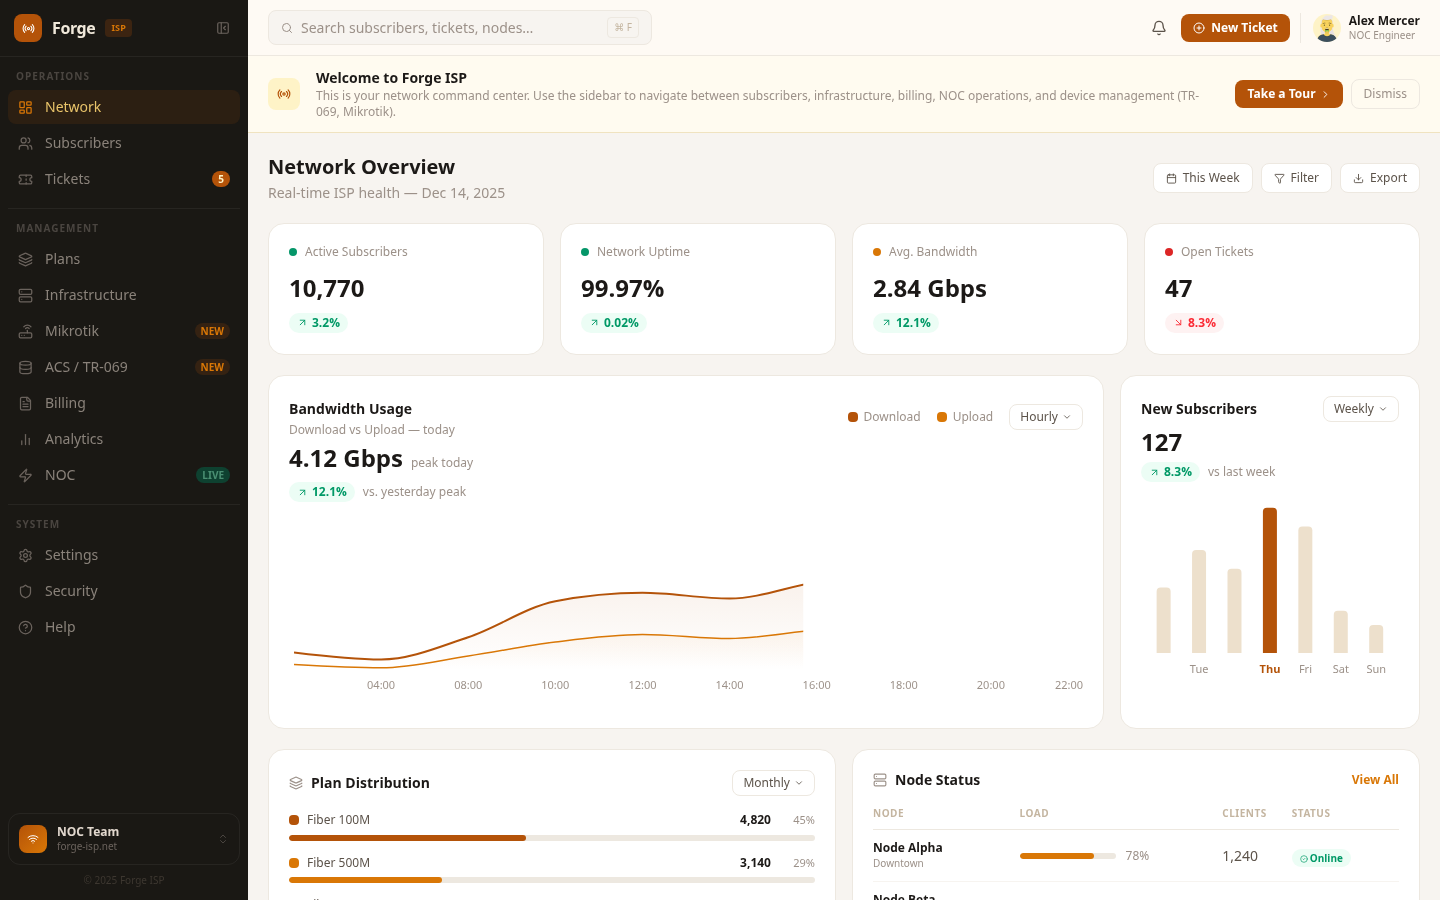
The default landing surface. Everything an operator needs in the first ten seconds of a shift: active subscriber count, network uptime, average bandwidth, and open tickets - each with a directional delta. A bandwidth chart with download / upload split, a weekly new-subscriber bar chart, plan distribution, and a live node status list with utilisation bars round out the morning report.
Subscribers - the customer ledger
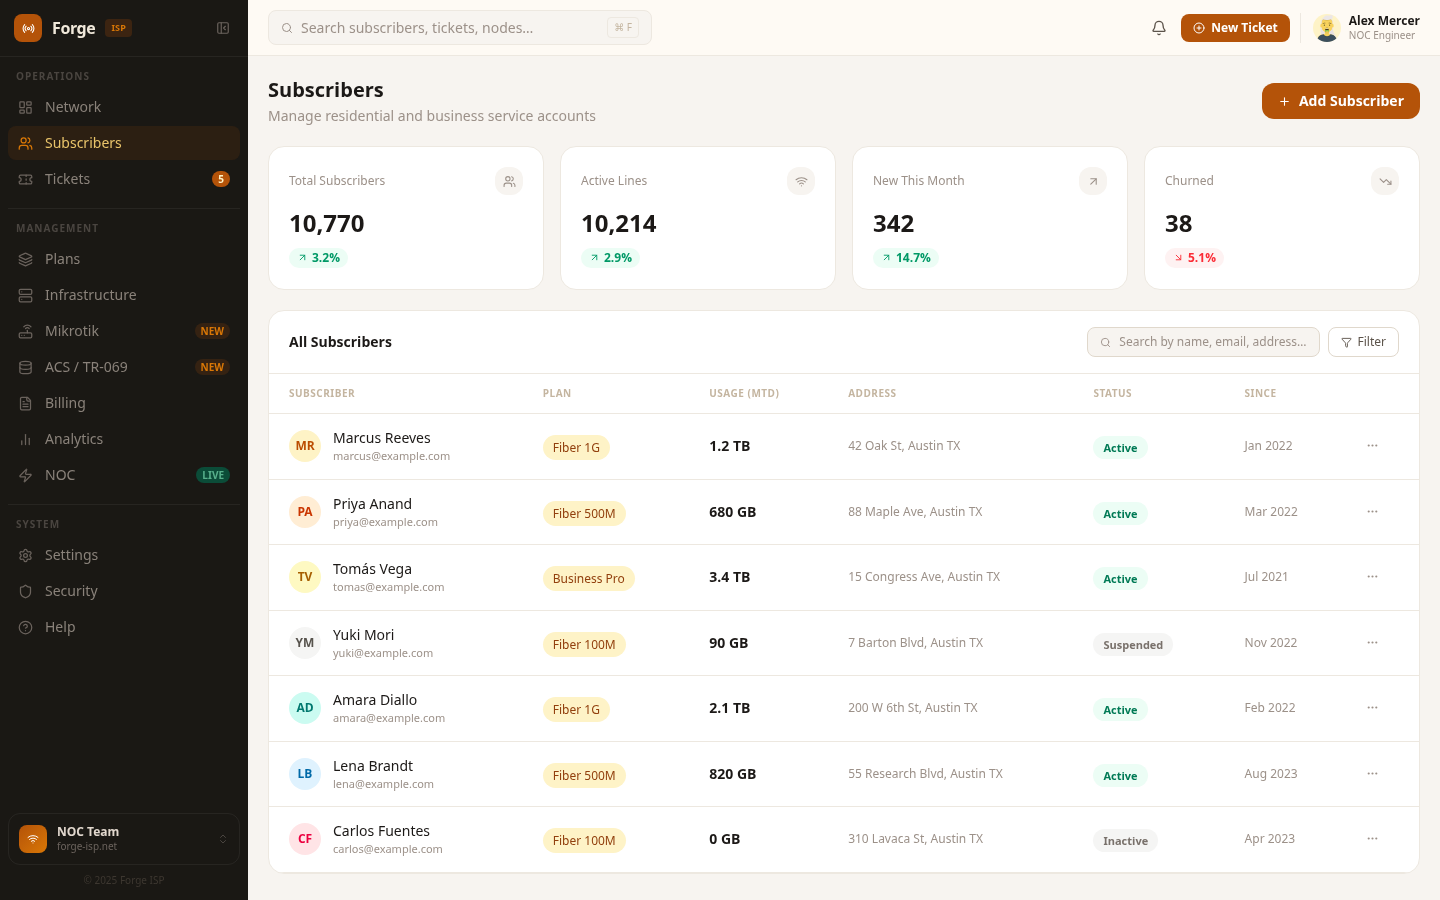
A searchable, filterable list of every service account. Status badges mark Active, Suspended, Overdue, and Churned. Bulk actions cover suspend, reactivate, and plan reassignment. Drilling into any row exposes profile, plan, payment history, CPE binding, and RADIUS session log.
Tickets - a workspace, not a backlog
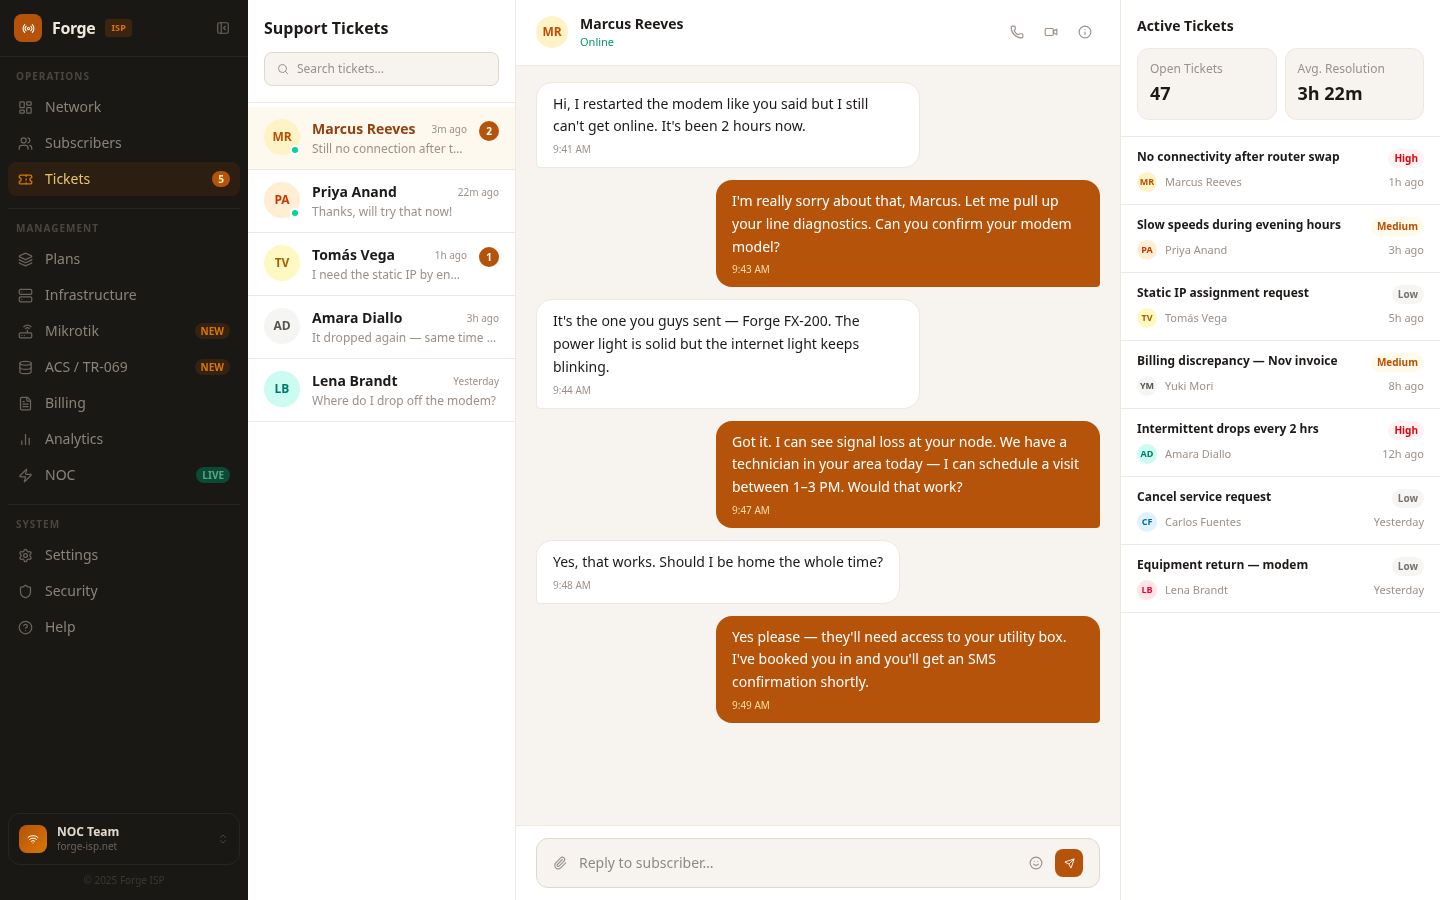
Tickets gets a bespoke layout - list panel on the left, conversation in the centre, active ticket sidebar on the right. The top bar collapses on this surface to give the conversation maximum vertical room. One click jumps from a ticket back to the bound subscriber profile.
Plans - the service catalog
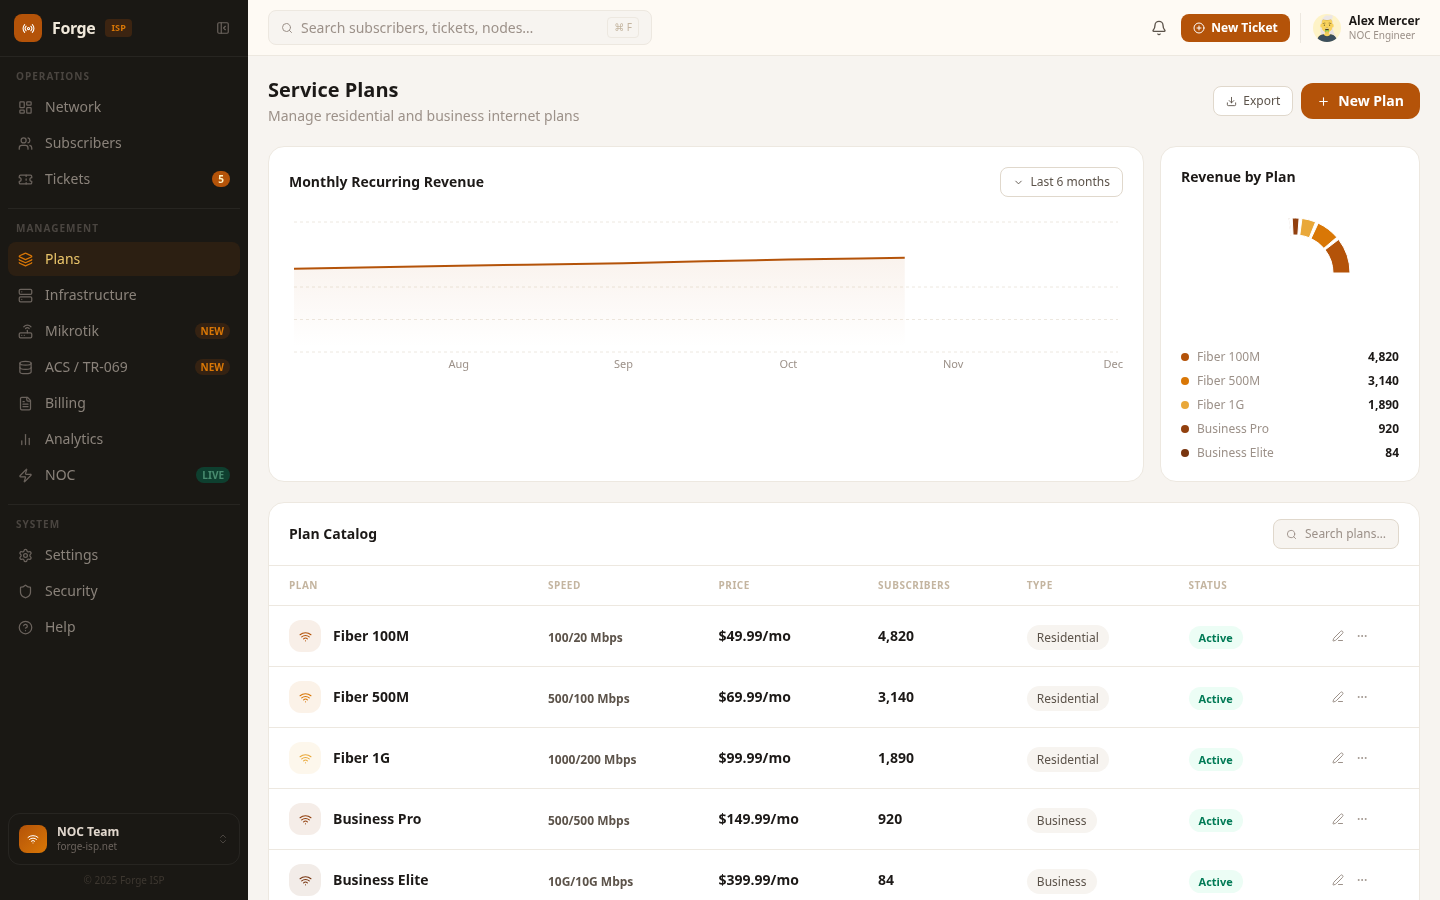
A visual inventory of every service plan with speed tier, price, and live subscriber count. Plan cards expose featured / legacy / discontinued flags. The editor handles speed limits, FUP policy, burst settings, and pricing in one place.
Infrastructure - physical and logical topology
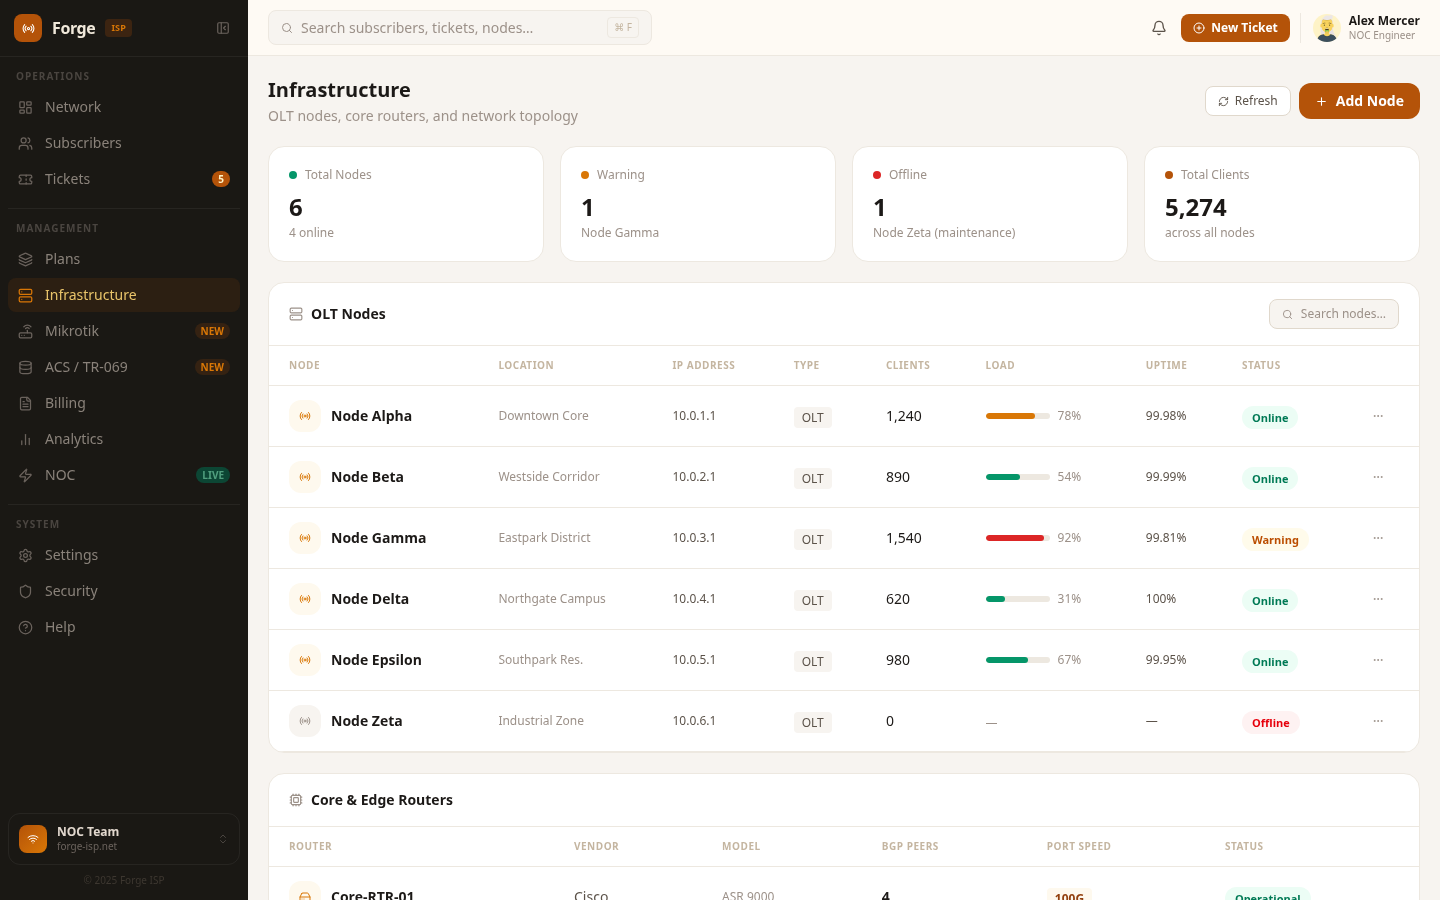
A full topology surface for PoPs, distribution nodes, and server hosts: node table with status, uptime, and load; per-host CPU, RAM, and disk; inter-node link health with latency and packet-loss columns; geographic region grouping for multi-market operators.
Mikrotik - RouterOS-native management
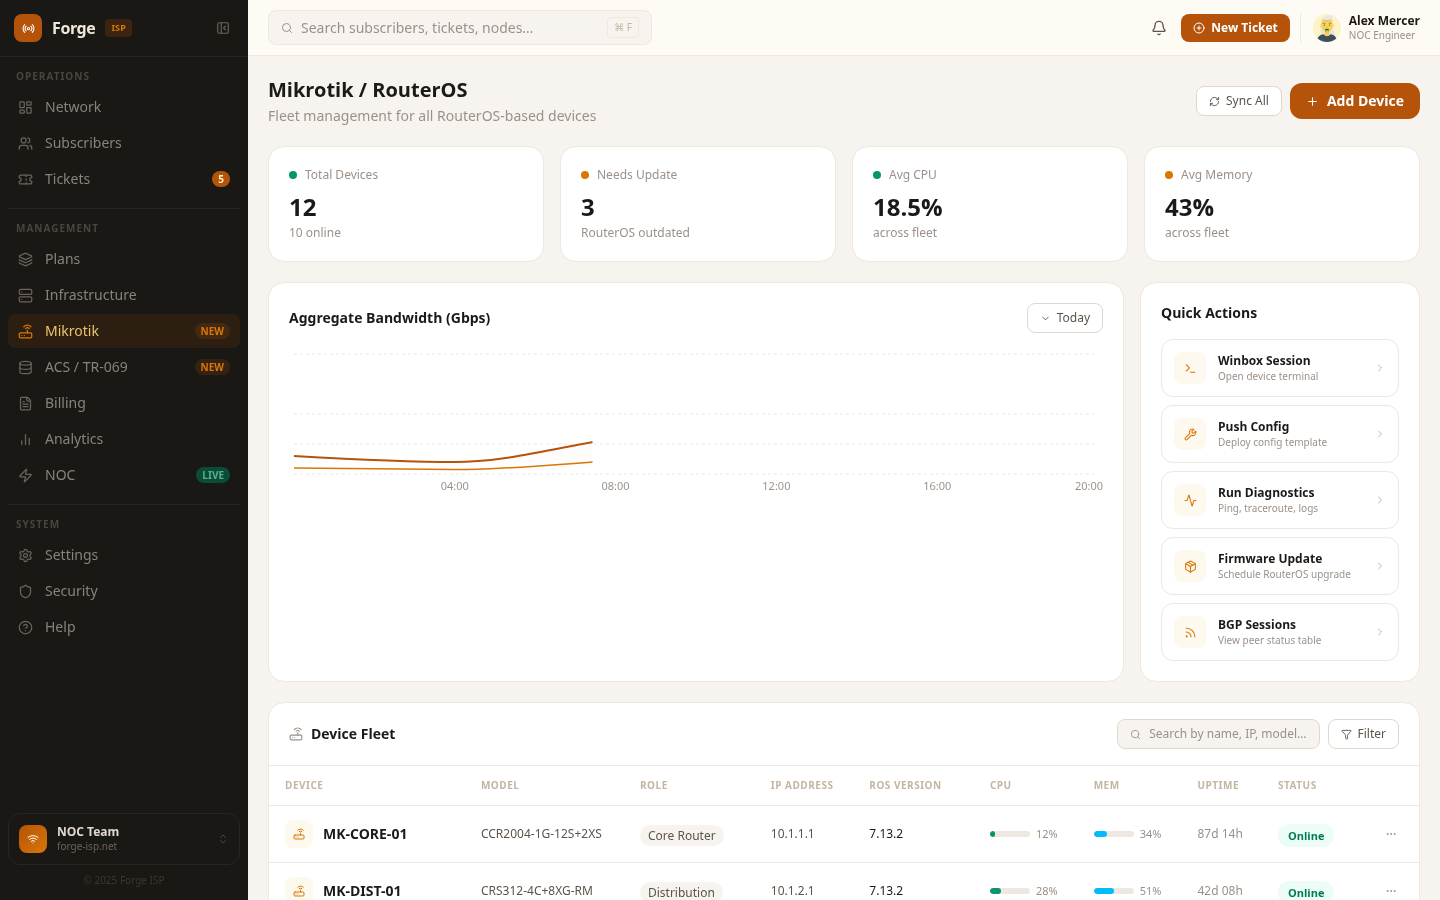
A dedicated surface for the workhorse hardware most independent ISPs run on: device roster across RB, CCR, and CRS series; per-node interface up/down state and traffic counters; live PPPoE session table bound to subscriber records; queue tree monitor; a script console for pushing RouterOS scripts to nodes or groups; BGP peer state on edge routers; and a live API connectivity indicator per device.
ACS / TR-069 - CPE lifecycle
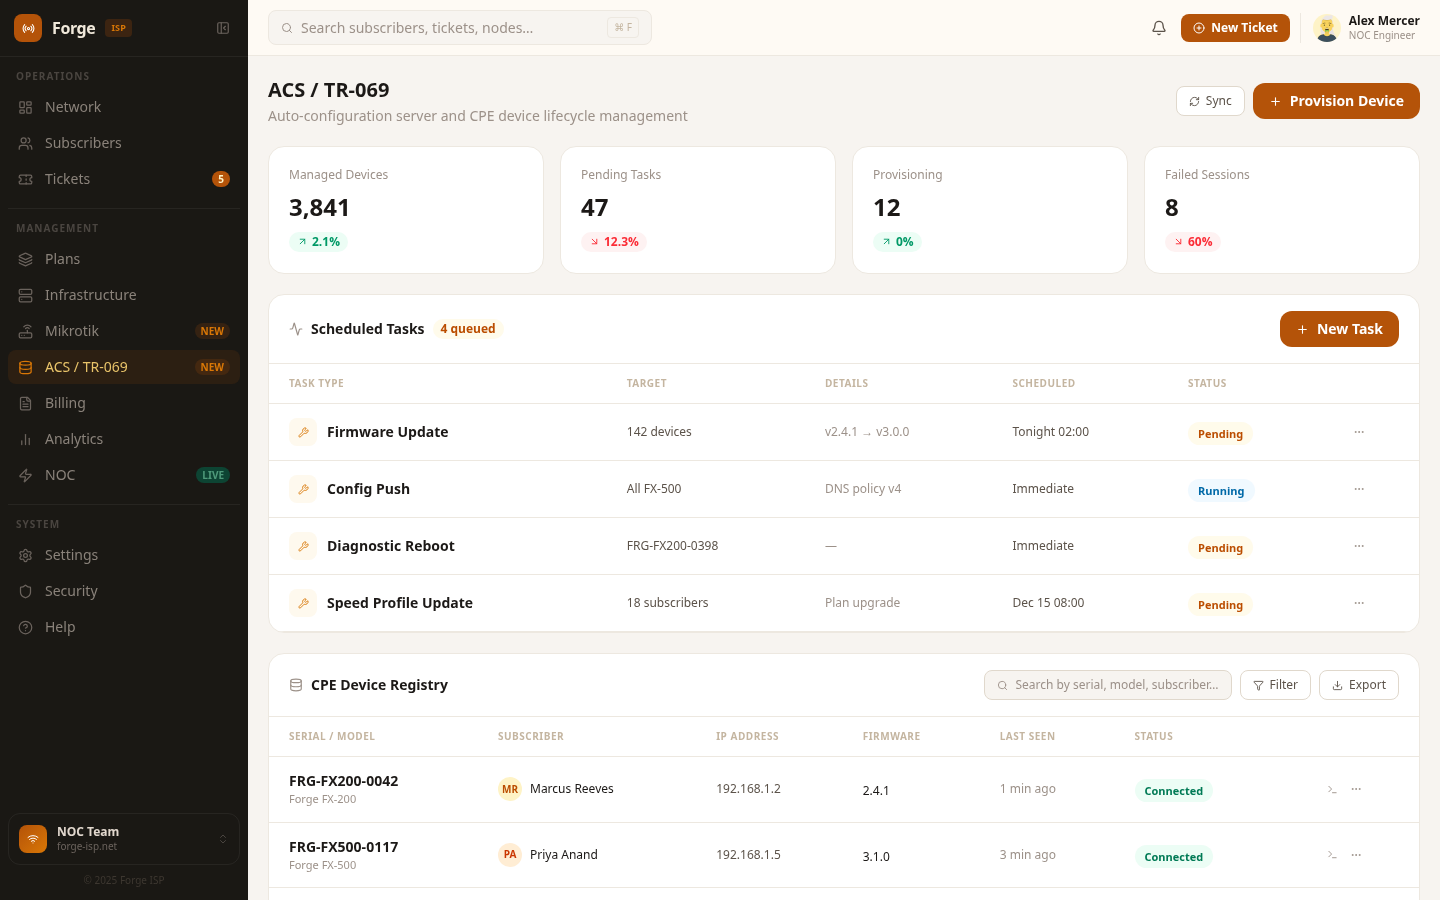
A full ACS panel structured around the TR-069 / CWMP standard, compatible with GenieACS, FreeACS, and commercial ACS platforms. CPE registry, live inform sessions, remote parameter get/set against TR-098 and TR-181 data models, scheduled firmware push across device groups, and remote ping / traceroute from the dashboard.
Billing - revenue operations
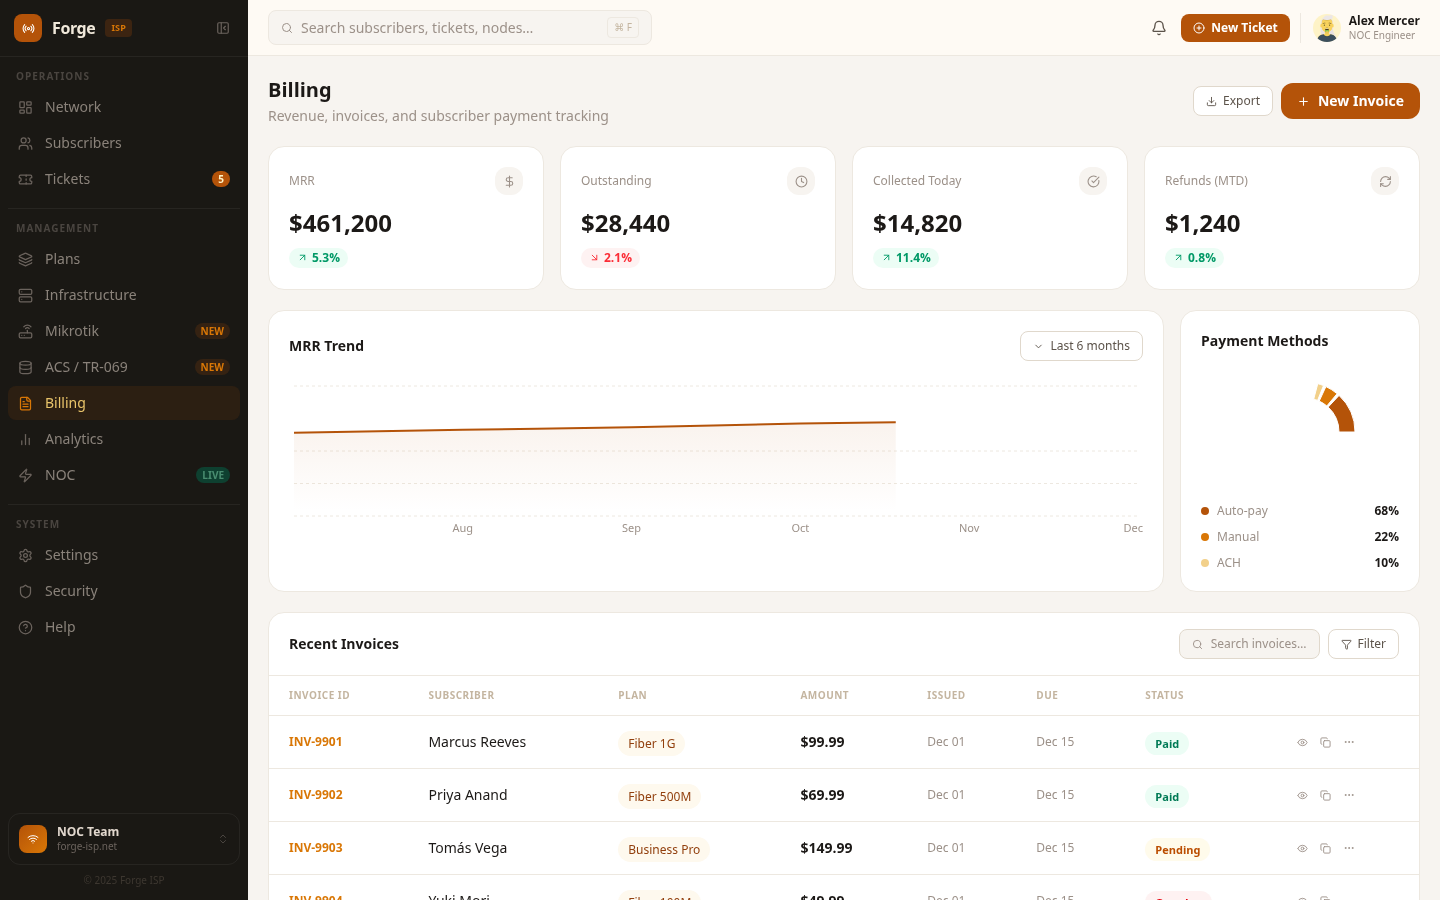
Top-level KPIs for MRR, ARR, collection rate, and outstanding balance. An invoice register with Paid, Unpaid, Overdue, and Void states. Per-subscriber and aggregate payment history. One-click CSV / PDF export for accounting handoff, and automated invoice generation triggered from plan assignment.
Analytics - operational intelligence
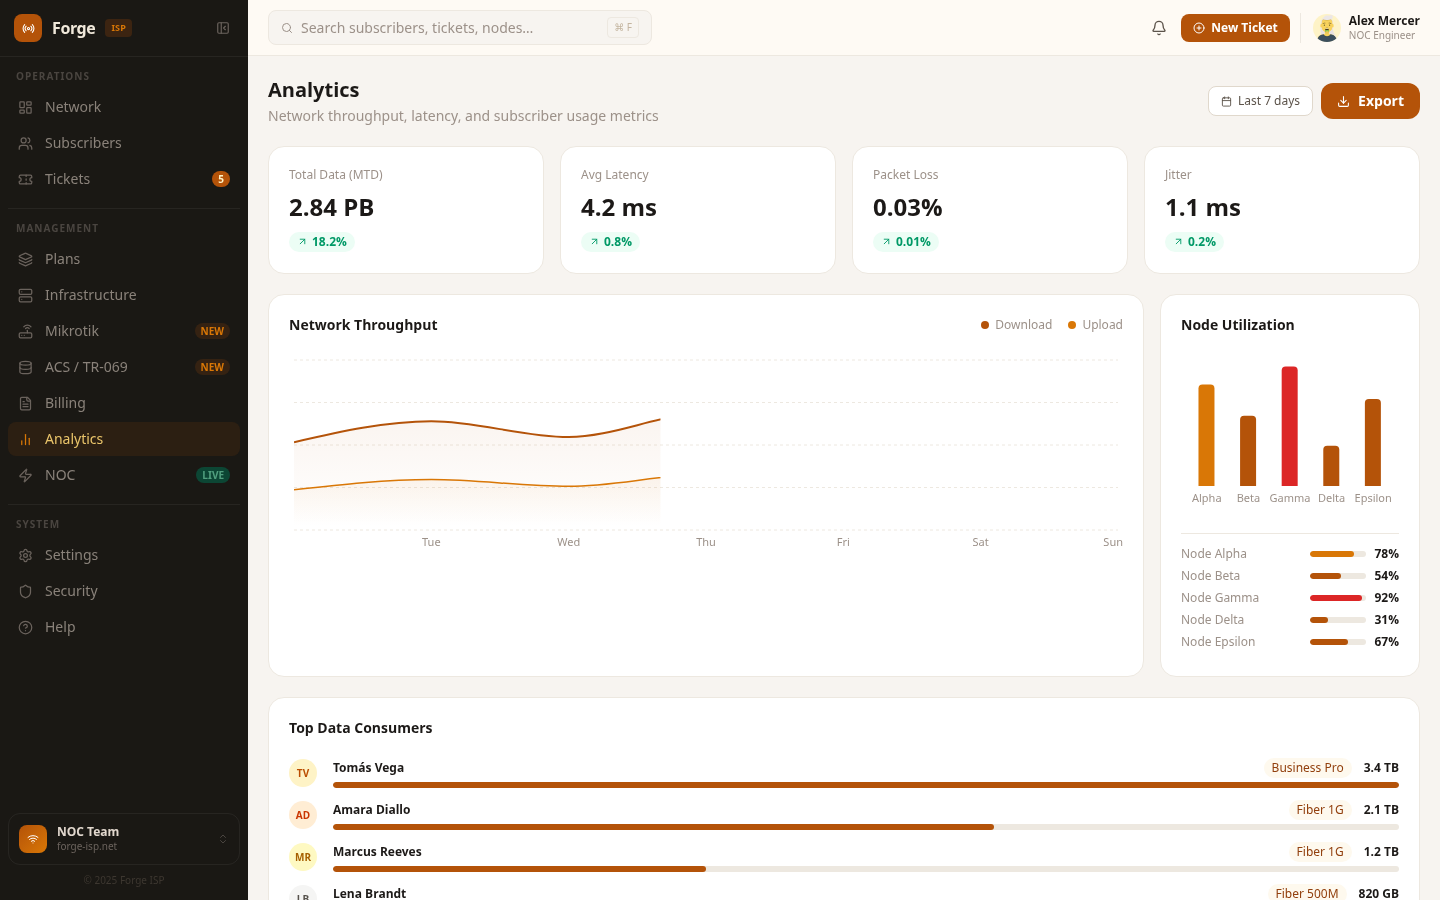
Cross-domain trends, not one-off charts: bandwidth across rolling 7-, 30-, and 90-day windows; subscriber growth with net adds, churn, and reactivation; a revenue trend line with forecast overlay; and a fault frequency heatmap surfacing the noisiest nodes.
NOC - the live incident floor
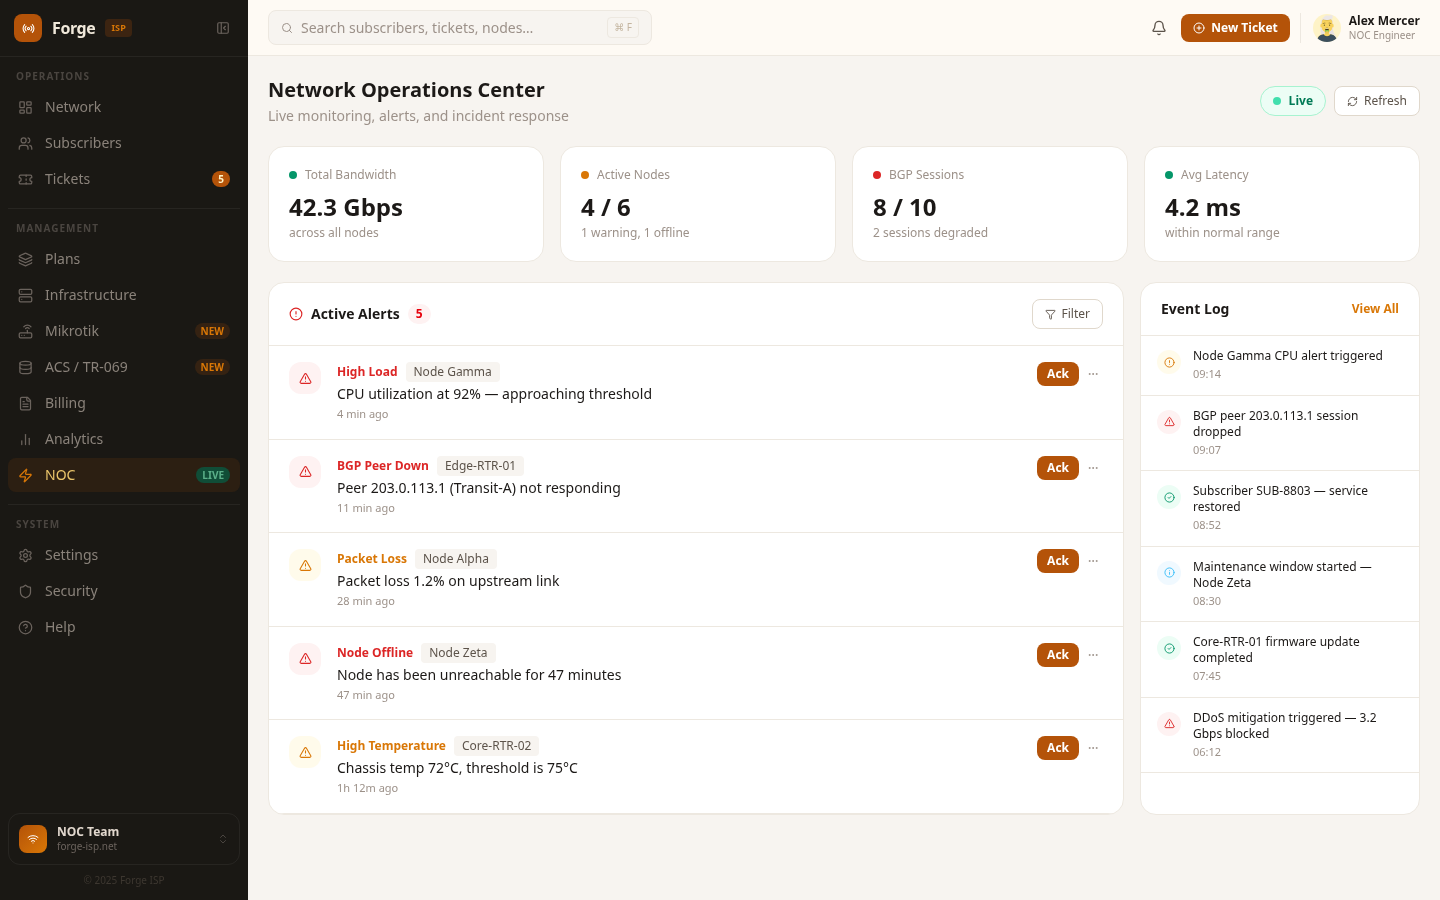
A streaming alarm feed with severity, source, and age. A persistent event log with ack-and-resolve workflow. A maintenance window scheduler that suppresses alerts during planned downtime. An on-call roster with active shift and escalation path, plus SLA timers per incident.
Settings, Security, Help
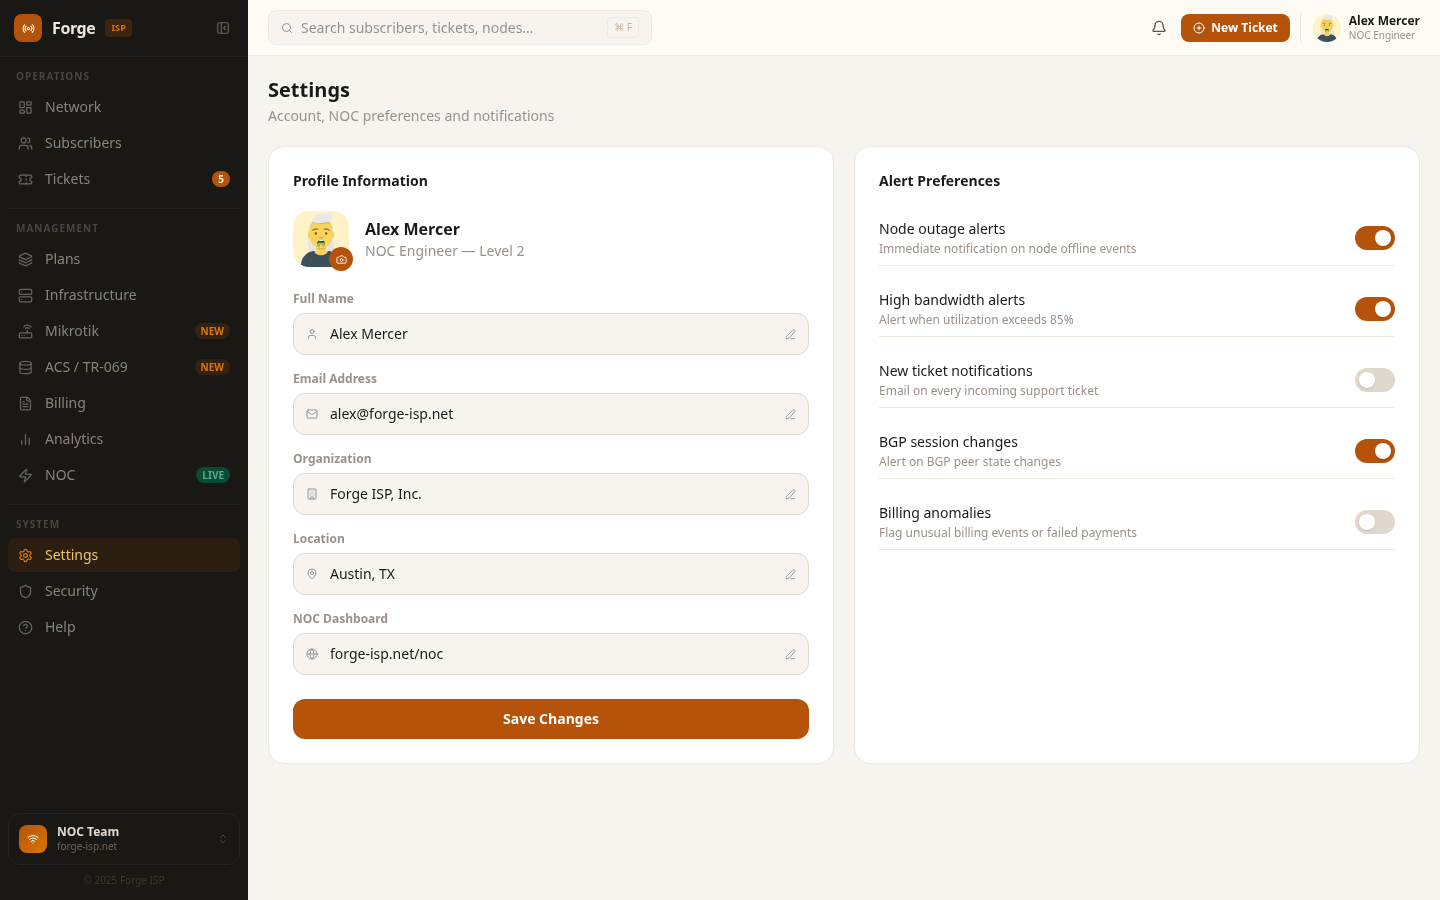
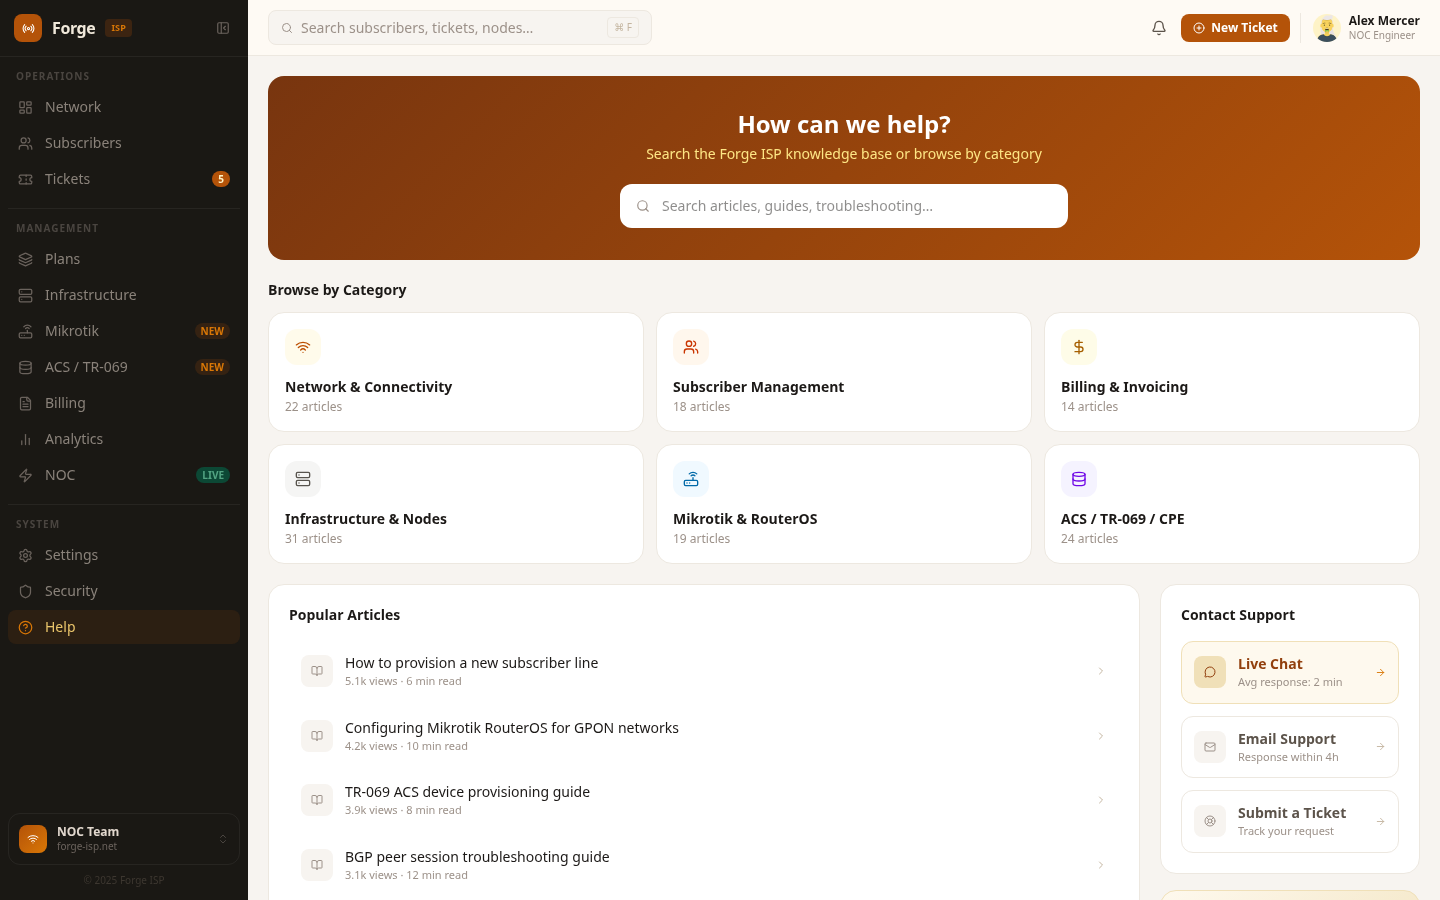
System-wide configuration in one place - organisation profile, notification routing across email / Slack / webhook, RADIUS and ACS endpoints, white-label branding for reseller deployments, and data retention policy.
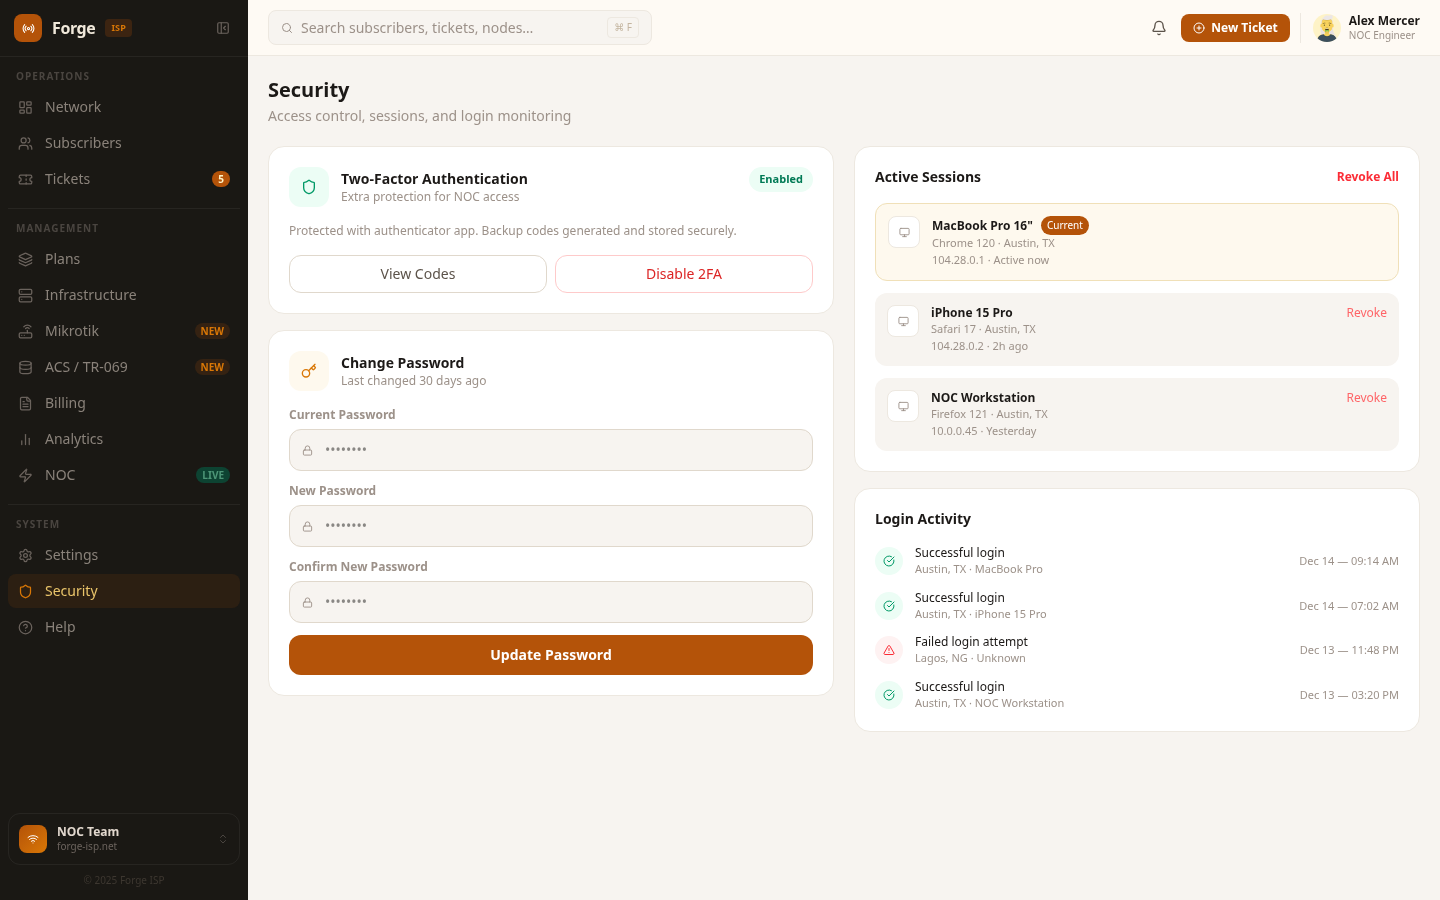
Roles for Admin, NOC, Support, and Read-only. A timestamped audit log of every configuration change and login. API key issuance and revocation, IP allowlisting, and per-user MFA enrolment status.
Interaction details
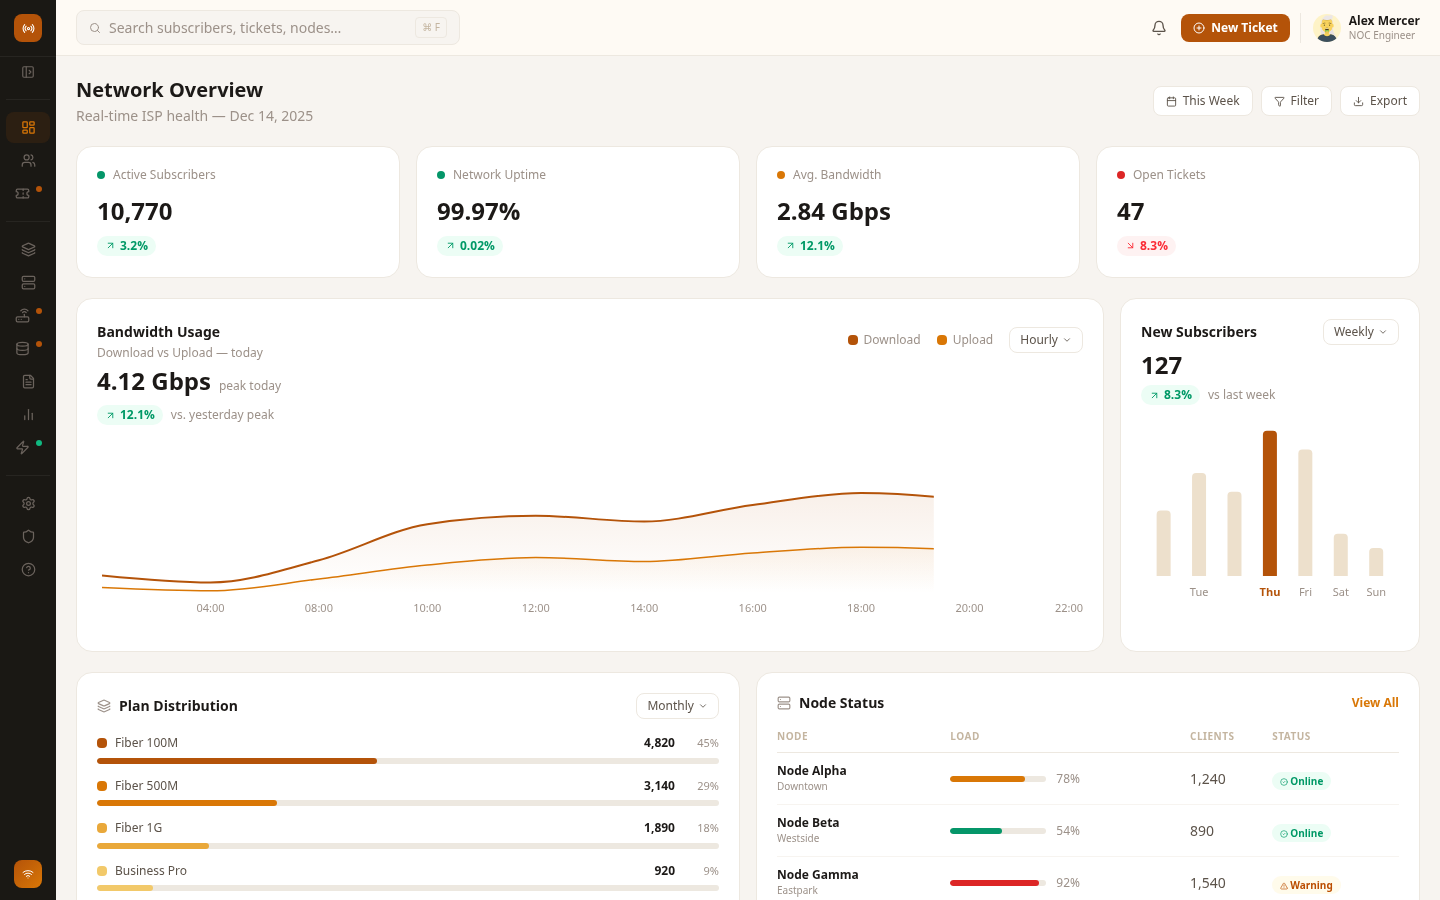
Collapsible sidebar. The navigation rail collapses from 248 px to 56 px on demand, expanding back on hover or toggle. The collapsed state persists across sessions.
Skeleton loading. Every page transition renders a shimmer skeleton matching the destination layout before data resolves. No layout shift, no jarring fill.
Page transitions. Framer Motion drives a subtle y: 12 → 0 and opacity transition over 200 ms with an ease-out curve. Enough motion to communicate layering, not enough to distract from monitoring work.
Visual system
The palette is centralised in a single token object so adjustments are a one-line change. Background warm stone #F7F4F0, sidebar deep warm near-black #1A1814, primary muted amber #B45309, and ghost-fill active states rather than solid highlights. Status colour is never the sole differentiator - every badge carries a text label, and contrast on primary text exceeds WCAG AA 4.5:1.
Technical decisions worth flagging
Single forced-light theme at runtime. The shell strips the dark class on <html> before React mounts and overrides system-preference change events. The dashboard is intentionally one calibrated environment rather than a flippable theme.
URL-param entry hooks. ?mode=editable and ?shouldSkipAnimations=true disable Framer Motion on first paint, making the workspace embeddable inside a host that needs deterministic layouts.
Component boundaries. A shell file owns the sidebar, top bar, collapse logic, loading states, and welcome gate. A pages module owns every page-level component and all shared sub-components - PageHeader, KpiCard, PrimaryBtn, OutlineBtn, StatusBadge - plus every chart configuration. Two files, clear ownership.
Tailwind CSS v4 with OKLCH tokens. No tailwind.config.js. The full token system lives in src/index.css using @theme inline, with shadcn-compatible variable names so any shadcn primitive drops in cleanly.
Outcome
Forge ISP shows what an ISP engineering dashboard should be in 2025 - unified, calm, deeply functional, and respectful of the operator's time. Not a simplified dashboard: a professional-grade tool designed for people who run networks for a living, built end-to-end with React 19, TypeScript, Vite, Tailwind v4, Framer Motion, and Recharts.
On the roadmap: a real-time WebSocket feed for live metric streaming, a RADIUS live session table, a ⌘K command palette, a right-slide notification drawer, an optional dark-mode toggle tuned for night shifts, multi-tenant / reseller views, and a mobile NOC alert view for on-call rotation.